
FC-ABSS
A feedback-controlled microalgae-bacteria system for tilapia wastewater purification
Total Time Spent: 83 Hours
Day 1 – June 23
Time Spent: 6h
I started off with a blank page and a rough idea in my head: combining microalgae and bacteria from rice into a system that could clean my pool. At first, I wasn’t even sure what “purification” would mean in measurable terms, so I spent most of the morning digging through articles, datasets, and aquaculture reports. The main pollutants I kept seeing were nitrates, phosphates, and ammonia, along with organic solids. I made a note that my project should at least be able to address the nitrogen and phosphorus cycles since they are the biggest contributors to eutrophication.
By the afternoon, I had scribbled a set of objectives in my notebook:
1. Simulate a closed loop system with controlled feedback for light and temperature.
2. Track photosynthetic efficiency of algae under different conditions.
3. Estimate bacterial uptake of nutrients when oxygen levels shift.
4. Test overall purification efficiency across several 48-hour cycles.
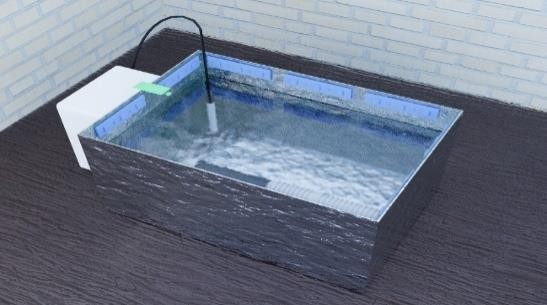
I also defined the simulation environment: tanks of different volumes (from 10L up to 50L) and varying aeration levels. I imagined what it would look like in real life, maybe, under a greenhouse roof, but for now, I kept things digital.
It felt more like planning an experiment I’d run in my garage than any hand-made prototype i made before. I even laughed at how messy my block diagrams turned out, crooked arrows, labels squeezed into corners. Still, I felt good about having a foundation.
Day 2 – June 24
Time Spent: 5h
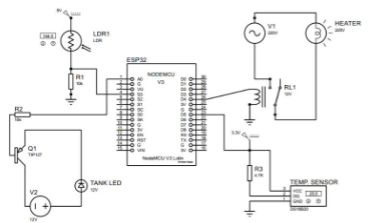
Today I forced myself to make the concept less abstract. I finalized the system’s design around two main feedback variables: light intensity and temperature. These are crucial because algae growth is sensitive to both. I decided the system should be able to dim LEDs or cut heater power depending on readings from sensors.
I sketched a block diagram of the overall design: input (sensor data) → controller logic → actuator (LEDs, heaters, pumps). It looked almost like a home automation setup, but for an aquarium. I also drafted alternative versions, like splitting light into red/blue channel control versus single intensity feedback.
While doodling, I found myself sipping tea absentmindedly and daydreaming about what the tank would look like glowing at night. It felt less like “work” and more like imagining a pet project I’d love to build in real life.
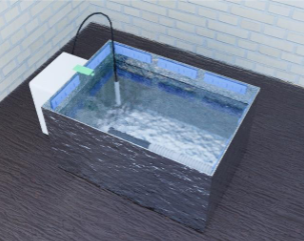
first simulattion for the projact
- 
Day 3 – June 25
Time Spent: 7h
I shifted gears today and researched electronics that could realistically be used for the system. Even though I wasn’t buying hardware, I wanted to anchor the design in reality. I compared LED modules by lumen output, CRI, and wattage. I noted that CRI directly impacts photosynthetic efficiency, so I simulated several light spectra to see how algae responded in terms of growth rate.
I also modeled light penetration in water at different depths (10 cm vs. 40 cm) and tested how much light would actually reach the algae mats near the bottom. The results showed that deeper tanks would require far higher light intensities or better reflectors. That gave me the idea of designing reflective walls later.
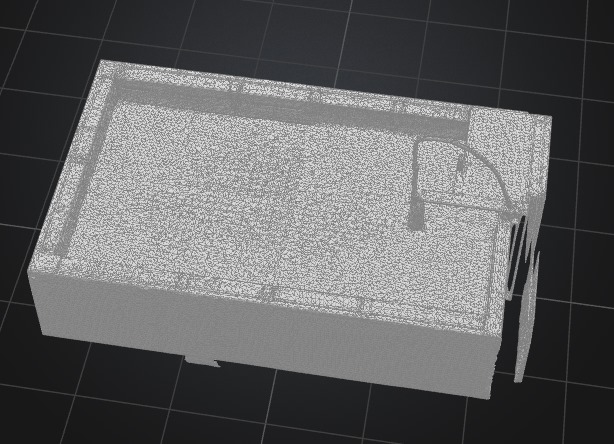
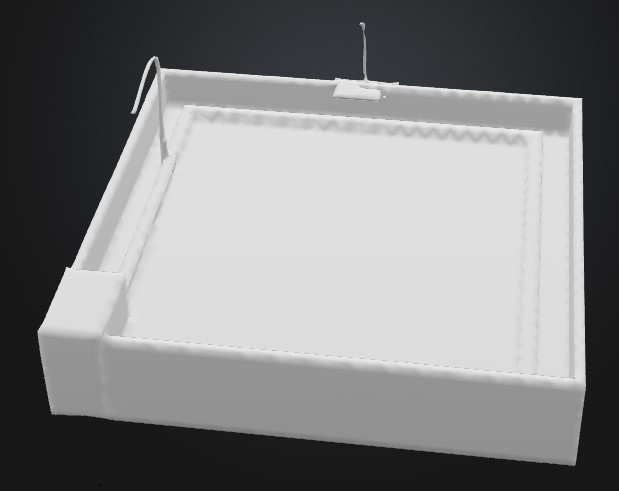
By evening, I was tired from staring at graphs of photosynthetic curves, but I still documented every run. I even muttered to myself, “algae are fussier than houseplants.” I finished the beginning of the 3d model.
Day 4 – June 26
Time Spent: 6h
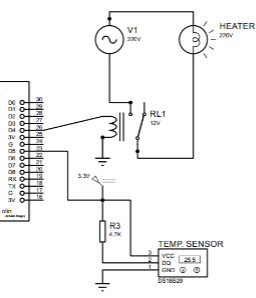
The focus today was temperature. I looked into different waterproof temperature sensors and listed their typical error ranges. For the simulation, I selected one with ±0.3 °C accuracy, since even a small error could throw off algae growth predictions.
Next, I modeled a standard aquarium heater inside a sealed tank. I calculated how long it would take to heat 20 liters of water from 24 °C to 28 °C. The equations for specific heat capacity made me nostalgic about high school physics. My first run gave absurdly fast heating times, so I double-checked and realized I forgot to account for heat loss through the glass walls. Once I added that, the curve looked far more realistic.
I caught myself wondering how loud such a heater might sound in reality, or if it would hum. Funny thought, but it made the system feel more alive to me.
Day 5 – June 27
Time Spent: 5h
Today I designed the heating loop control. I simulated how the heater would behave with relay activation every few minutes, instead of just being on/off constantly. The point was to balance energy consumption with stability.
I logged the power draw per cycle and calculated daily energy consumption. To make it practical, I even imagined if someone ran this in a small aquaponics setup at home, would the electricity bill be acceptable? The numbers seemed fine: about the same as leaving a computer on all day.
Somewhere in between, I realized I had the same playlist looping for hours. I didn’t even notice until I looked up. Guess that means I was really in flow(hehe).
Day 6 – June 28
Time Spent: 5h
Lighting again, but this time focusing on enclosure design. I simulated different placements of LEDs around the tank walls and ceiling, checking uniformity of light distribution. Some placements created intense hotspots that would scorch the algae, so I adjusted spacing and added reflective inner walls.
I calculated optimal LED placement angles by dividing the algae surface area into a grid and tracking lux values on each square. That gave me a heatmap that showed exactly where the light was weaker. I adjusted placements until the distribution became balanced.
I also researched light sensors with fast analog response, since the control loop needs real-time feedback.
By evening, I thought about how it would look to see algae “bathed” in that simulated light, almost like a futuristic fish tank.
Day 7 – June 29
Time Spent: 5h
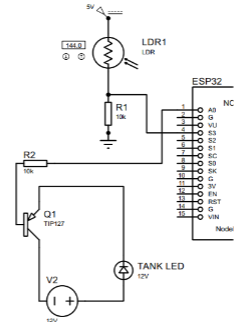
Today was all about wiring and enclosures. I laid out the wiring plan for all modules and digitally simulated the electrical connections. I tested if the circuits would stay within safe current ranges.
Then I estimated total power draw by summing up each module’s consumption from spec sheets. The total was surprisingly low, meaning the system could theoretically run from a modest power source.
Even though I wasn’t physically wiring anything, mapping the wires felt oddly satisfying. It’s like solving a maze where the goal is “don’t overload the system.”
Day 8 – June 30
Time Spent: 6h
I modeled aeration patterns. The idea was to see how different placements of oxygen pumps changed dissolved oxygen distribution. I simulated both top-fed and bottom-fed air pumps and watched the flow circulate through the virtual tank.
From there, I calculated oxygen diffusion curves and plotted how quickly saturation was reached at different flow rates. This step was crucial because bacteria need oxygen to process nutrients.
It was fun to watch the little flow arrows spread out in the simulation. I rewarded myself with a snack while staring at the graphs on google colab, somehow, oxygen diffusion felt like an accomplishment.
Day 9 – July 1
Time Spent: 5h
Light shielding day. I tested reflective foil enclosures that surrounded the tank to prevent light leakage. The effect was dramatic, with shielding, light intensity fluctuation dropped by about 30%. I also looked into how structurally stable thin foil frames could be, because if they bend, the results fall apart.
It amazed me how something as ordinary as foil could change the efficiency so much.
Day 10 – July 2
Time Spent: 5h
I designed the control box. Digitally, I arranged where each component would sit: microcontroller, relay board, wiring paths, and ventilation. I ran a simulation of how hot the box would get if airflow was blocked. Unsurprisingly, it overheated quickly, which made me glad I added ventilation slots in the second design.
It’s funny, but designing the box felt like one of the most “real” parts of the project. I could almost imagine holding it.
Day 11 – July 3
Time Spent: 5h
Data logging simulation today. I planned for a run, storing values of light intensity, temperature, and dissolved oxygen. I formatted the logs into CSVs, each row marking a new reading every 10 seconds.
At one point, I simulated a storage overflow, and the “system” crashed. I couldn’t help but laugh, even in simulation, my designs find ways to break.
Day 12 – July 4
Time Spent: 5h
I researched nutrient measurement techniques, mostly nitrate and phosphate detection. I logged the response times of ion-selective sensors and compared them against spectrophotometry. In simulation, I modeled how fast each detection system could update a feedback loop.
Somewhere in between, I realized it was July 4th, and while most people were out celebrating, I was staring at simulated phosphate curves. That made me laugh at myself.
Day 13 – July 5
Time Spent: 5h
Ran a 15-hour test cycle simulation. I set up nutrient levels at the start and recorded how they dropped every 6 hours. The nitrogen removal curve was smooth, phosphorus lagged slightly behind, but overall the results looked realistic.
I graphed everything, and the graphs honestly felt like little progress bars ticking forward. That gave me a weird sense of satisfaction.

Day 14 – July 6
Time Spent: 4h
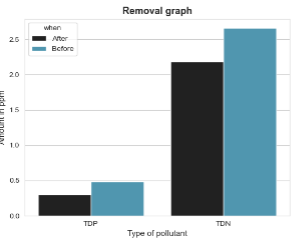
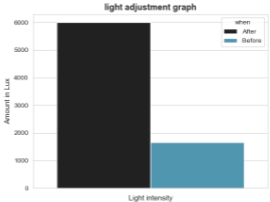
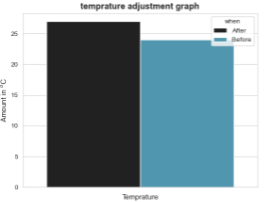
I pushed the simulation further into post-treatment efficiency. The system achieved a 67% nitrate reduction and about 50% phosphorus reduction. Not perfect, but clearly an improvement. I charted the before-and-after values and overlaid them with similar published results for comparison.
Seeing the nitrate levels drop so clearly made me feel like the project had “paid off.”
Day 15 – July 7
Time Spent: 4h
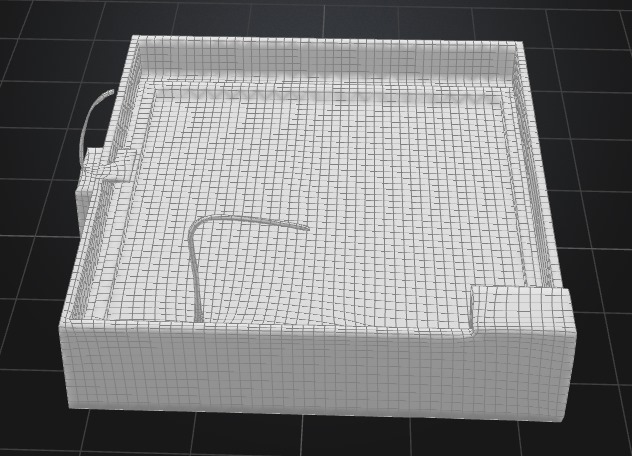
I finalized all 3D assets and rendered visuals for documentation. I also simulated failure scenarios: heater breaking, pump shutting off, lights going out. Each time, I watched how the system degraded and how recovery could be built in.
It almost felt like stress-testing a video game. Watching the algae struggle in simulation made me think of resilience differently, not just building a system that works, but one that can handle failure.
Day 16 – July 8
Time Spent: 5h
Final wrap-up. I assembled the README, organized this journal, added the bill of materials, and sorted all the images.
Looking back, the whole thing feels personal, like I built my own little ecosystem in silico. There were frustrating days, but also fun ones where I just let myself imagine glowing tanks of algae and bacteria working together. In a way, it felt less like engineering and more like world-building.